Just going to do some maths here, don't mind me:
If we assume the cost of fully upgrading a printer remains static, the change in payback time (in minutes, because why not) can be roughly modeled by the graph 60(k/x), where x denoted the cost per hour of the printer, and k is a constant denoting the upgrade cost of the printer.
Let's plot the graph for a nuclear printer (I will assume data from the tables are correct, pardon if I make any mistakes.)
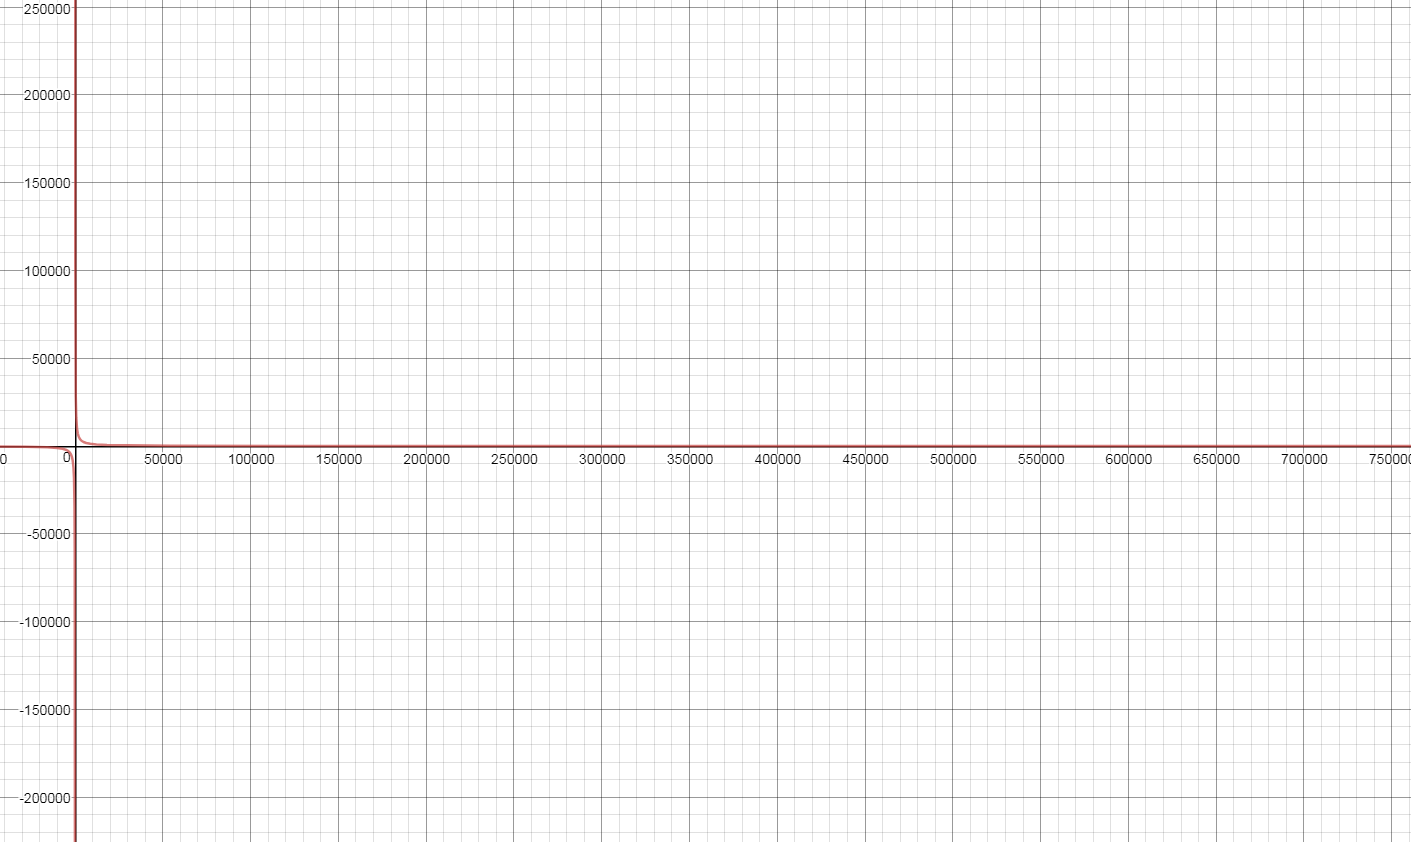
The graph below is the graph (Y = 11079960 / x), the Y axis displays time taken for the printer to pay for itself and the x axis is the rate at which the printer produces money:
As you can see the recuperation time at the current value of X is quite far along the tangent. The graph tends towards Y = 0 when X tends towards infinity, but does so in increasingly smaller increments as you go further along.
This seems all well and good, but let's say we double the rate of production, it is of course easy to see that you halve the recuperation time.
To maintain the same time to regain costs (which I'm sure is an important balance issue,) you'd simply have to chose your X value and use the equation Y / X = 38/60, or Y = 38/60X.
tl'dr: there is no problem with this, but you would have to adjust costs to keep payback times reasonable.


 Discord